The REST API step by step
This chapter shows the control API at work: first one run that is watched, sped up and stopped, then the service that takes run after run. Every picture is what the commands printed. The examples use curl, which is part of Linux, macOS and Windows 10 and later; any program that speaks HTTP does the same. The requests and their answers are listed in The control API and The service: runs on request.
Every request needs the token. The examples keep the header in a shell variable, so the commands stay short:
H="Authorization: Bearer s3cret-token"
curl -s -H "$H" http://10.0.0.5:8080/status          (Linux, macOS)

curl.exe -s -H "Authorization: Bearer s3cret-token" http://10.0.0.5:8080/status          (Windows)
The control page in a web browser
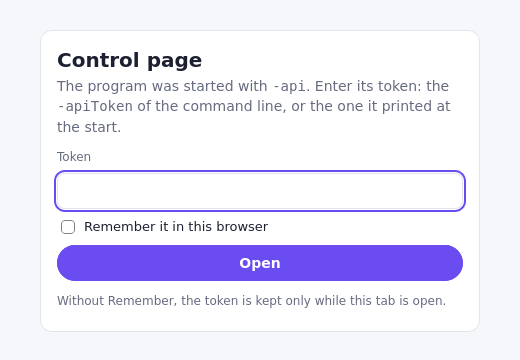
The API has a page of its own for a web browser: http://<address>:<port>/ui, for example http://10.0.0.5:8080/ui. The program prints the address at the start (Control page: ...). Nothing is installed and nothing comes from the internet: the page is part of the program, so it works in a lab network too. It asks for the token once:
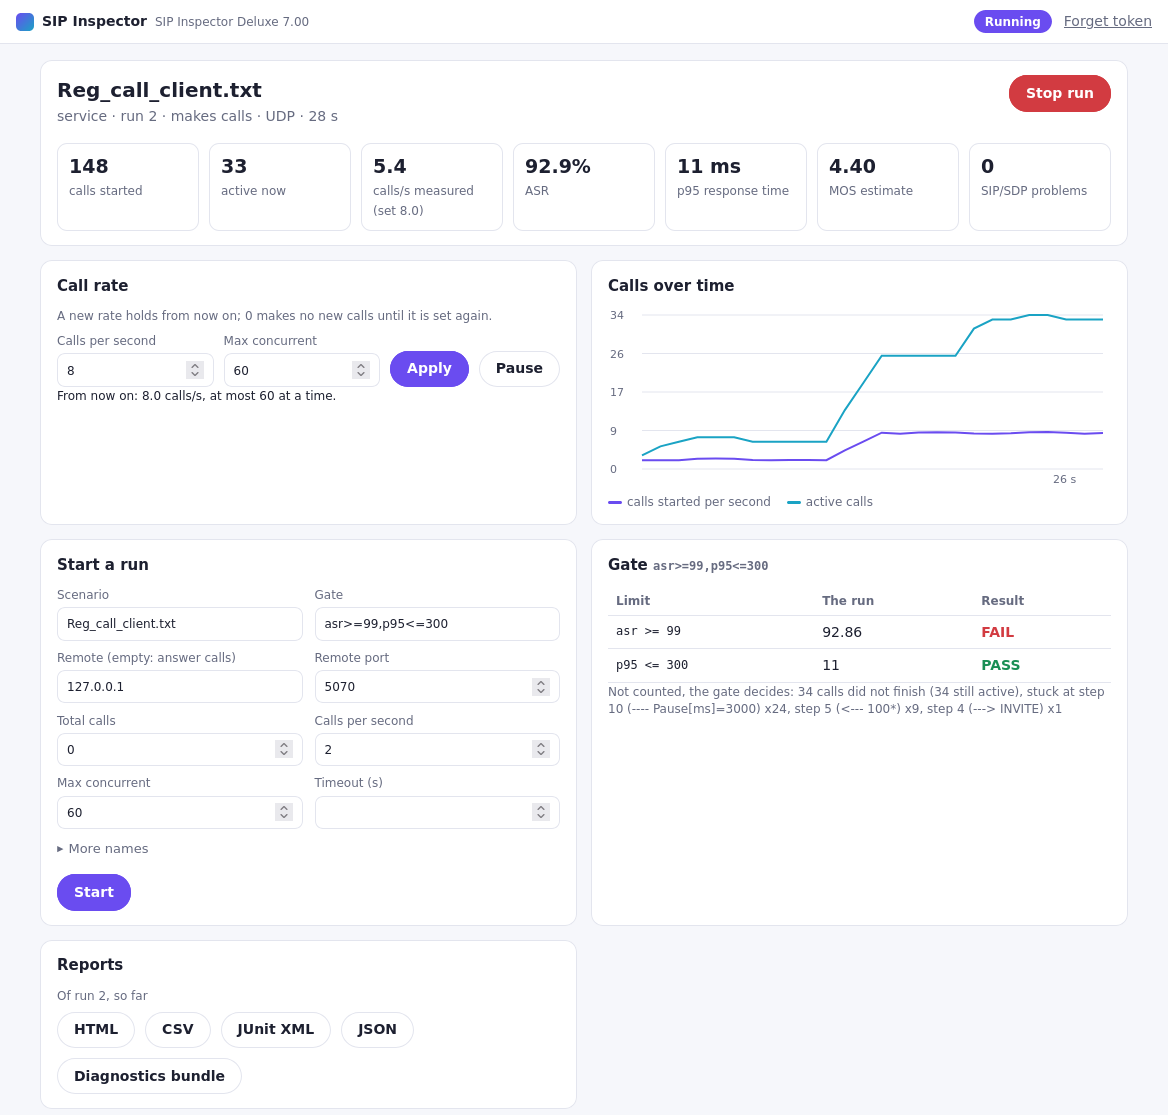
Then it shows the run as it goes on, refreshed every second: the calls, the measured rate, the ASR, the p95 response time, the MOS and the SIP/SDP problems, a chart of the calls over time, the gate, the steps of the scenario, the checks and the call flow of a call. It has what the requests of the API do, as buttons:
- Call rate - a new rate or limit of calls at a time, from now on; Pause sets 0 calls a second (a client only).
- Stop run - ends the run like Ctrl-C, with its reports. Shut down the program ends the program.
- Reports - the HTML report opens in a new tab; CSV, JUnit XML, JSON and the diagnostics bundle are saved.
- Start a run and Runs (the service) - the form of POST /run: the scenario, the remote end, the calls, the rate, a gate and, under More names, any other name of a run as JSON. The runs are listed with their result and their reports.
- Browse... next to the scenario lists the scenario files on the computer SIP Inspector runs on, with a filter; a click puts one in the form. Upload... sends a scenario file of your own computer: it is kept in scenarios/uploads there and put in the form.

The token. The page keeps it only while its tab is open, unless Remember it in this browser is ticked; Forget token removes it. Every request the page makes gives it, like curl does; the page itself has nothing secret and comes without a token. A page of another web site cannot use the API through your browser: the API answers it with 401, as it has no token. The page follows the light or dark theme of the computer, and fits a phone too.
1. A run with the API
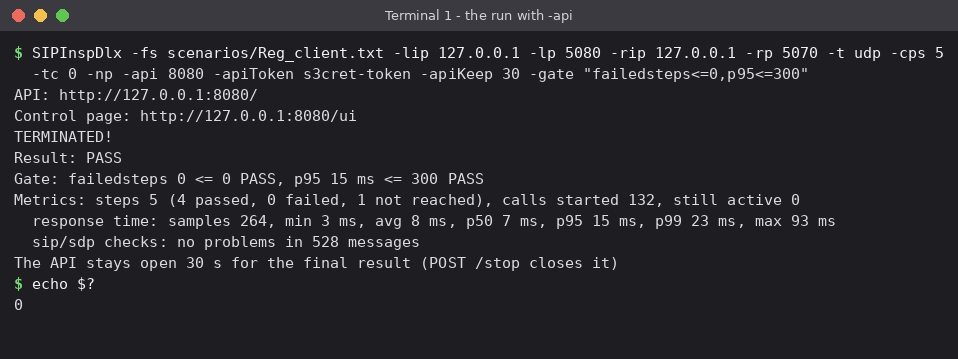
The client registers users, 5 a second and with no end of its own (-tc 0), against a server on port 5070. -api 8080 opens the API, -apiToken sets the token (without it the program makes one and prints it), -apiKeep 30 keeps the API open 30 seconds after the end so the result can still be read, and the gate decides the result. The program prints where the API is, then works as usual:
SIPInspDlx -fs scenarios/Reg_client.txt -lip 127.0.0.1 -lp 5080 -rip 127.0.0.1 -rp 5070 -t udp -cps 5 -tc 0 -np \
           -api 8080 -apiToken s3cret-token -apiKeep 30 -gate "failedsteps<=0,p95<=300"
API: http://127.0.0.1:8080/
Control page: http://127.0.0.1:8080/ui
2. Watch it and change the rate
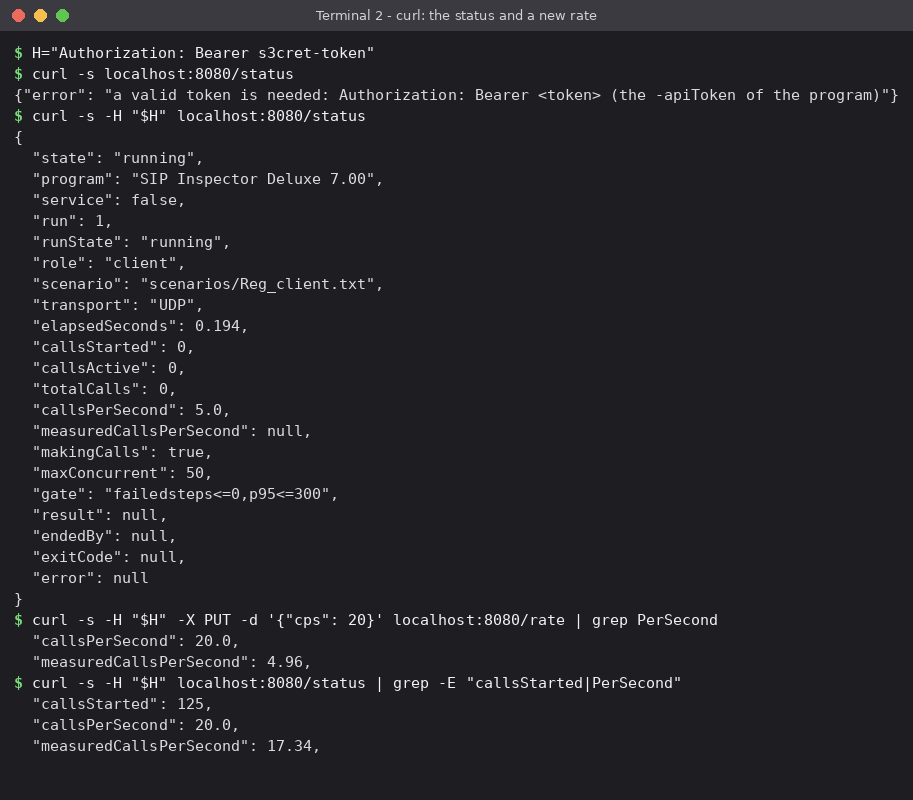
From another terminal, or another computer when the API listens there (-apiHost). A request without the token gets 401. GET /status says what the run does now. PUT /rate sets a new rate from now on and answers with the status; a few seconds later the measured rate has followed:
| In the status | What it is |
|---|---|
state | idle (the service between runs), running or finished |
program | The name and the version of the program |
run, runState | The number of the run, and its state: starting, running, finished, or failed (a run that could not be started) |
role, scenario, transport | client (makes calls) or server (answers them), the scenario file and the transport |
elapsedSeconds | How long the run has been going |
callsStarted, callsActive, totalCalls | Calls started so far, calls going on now, and the end (-tc; 0: no end) |
callsPerSecond, measuredCallsPerSecond | The rate that is set, and the rate measured since the last change |
makingCalls, maxConcurrent | Whether new calls are made now (false at cps 0 or after the last one), and the limit of calls at a time |
gate | The limits of -gate, or null |
result, endedBy, exitCode | After the end: PASS or FAIL, how the run ended (all calls done, stopped by the API, a signal, the timeout) and its exit code |
error | Why a run could not be started (the service), or null |
3. The numbers
GET /metrics gives the numbers of the run so far as the JSON report: the verdict, the gate with the number of every limit, and the totals. With ?format=prometheus they are Prometheus text, one number a line:
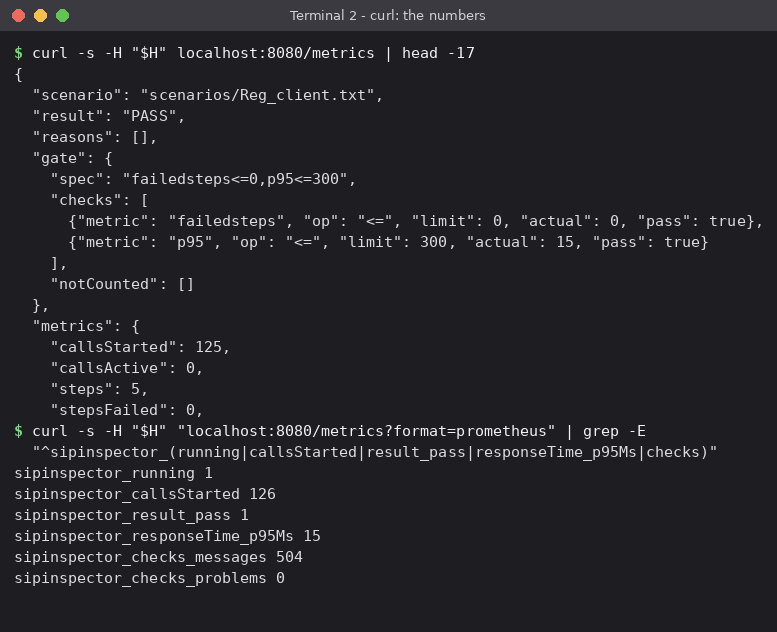
Prometheus reads them directly. A scrape job, every 5 seconds, with the token:
scrape_configs:
  - job_name: sipinspector
    scrape_interval: 5s
    metrics_path: /metrics
    params:
      format: [prometheus]
    authorization:
      credentials: s3cret-token
    static_configs:
      - targets: ["10.0.0.5:8080"]
A Grafana panel then charts, for example, sipinspector_responseTime_p95Ms, sipinspector_calls_asrPercent, sipinspector_rtp_mosAvg or rate(sipinspector_callsStarted[1m]); sipinspector_running is 1 while the run goes on and sipinspector_result_pass is 1 while the result would be PASS.
4. Stop it and read the result
POST /stop ends the run like Ctrl-C: the calls that are going on are stopped, and the reports are written as at a normal end. The status then has the result and how the run ended, and GET /report gives the report in any format. Because of -apiKeep the API stays open; a second POST /stop closes it at once.
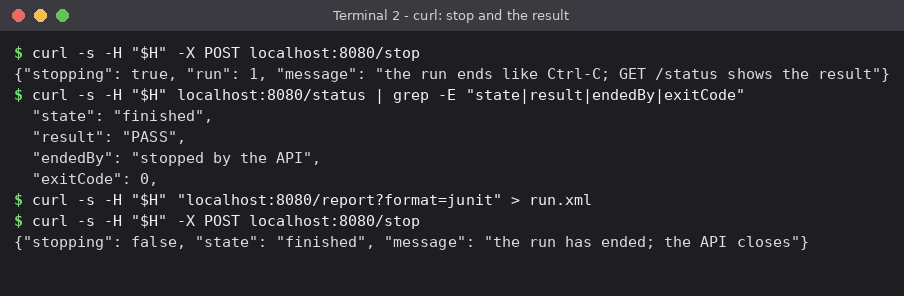
The run itself printed its summary and ended. With the gate the limits decide, so a run without an end of its own that is stopped over the API passes when its numbers are good (exit code 0):
5. The service
The service makes no run of its own: it waits for POST /run. A test lab keeps two of them, one that answers the calls (on the device side, or in place of a device) and one that makes them, and a script drives both. What both share is on their command line; what changes from test to test is in the runs. Here both are on one computer, on ports 8081 (answers) and 8082 (calls):
SIPInspDlx -api 8081 -apiToken s3cret-token -lip 127.0.0.1 -lp 5070 -t udp
SIPInspDlx -api 8082 -apiToken s3cret-token -lip 127.0.0.1 -lp 5080 -t udp -au alice -ap secret
The answering service gets a run without remote, so it answers, for at most 60 seconds. The calling one gets 6 calls with a gate. Each answers 202 with the number of the run at once; the run goes on in the background. A second run while one is going on gets 409:
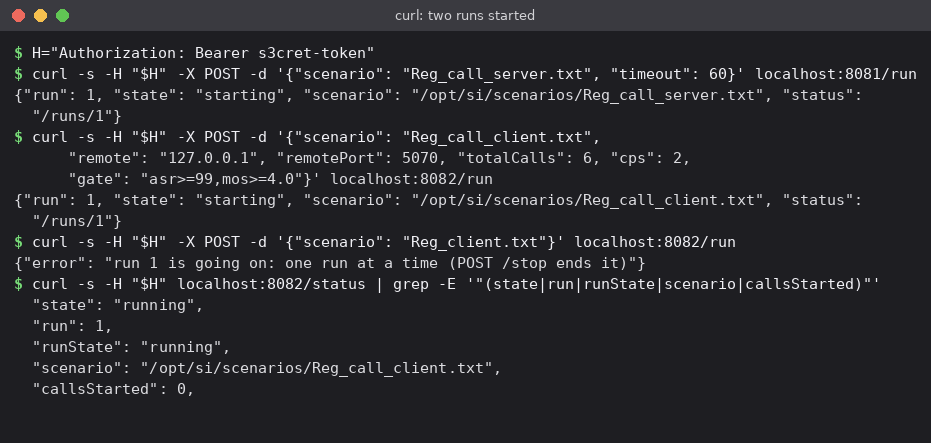
GET /runs lists the runs (the last 20 are kept), and GET /runs/N one of them with what was asked for. The reports of every run stay: ?run=N picks one. The answering run, which has no end of its own, is stopped:
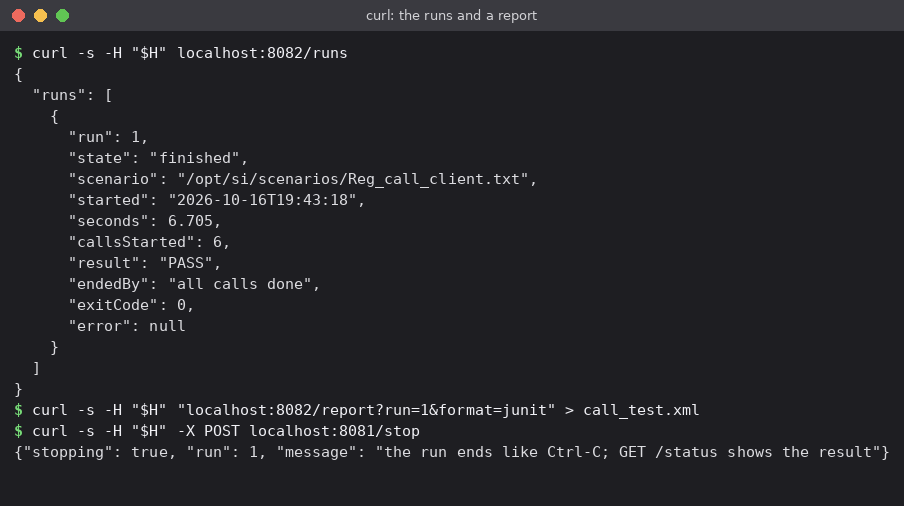
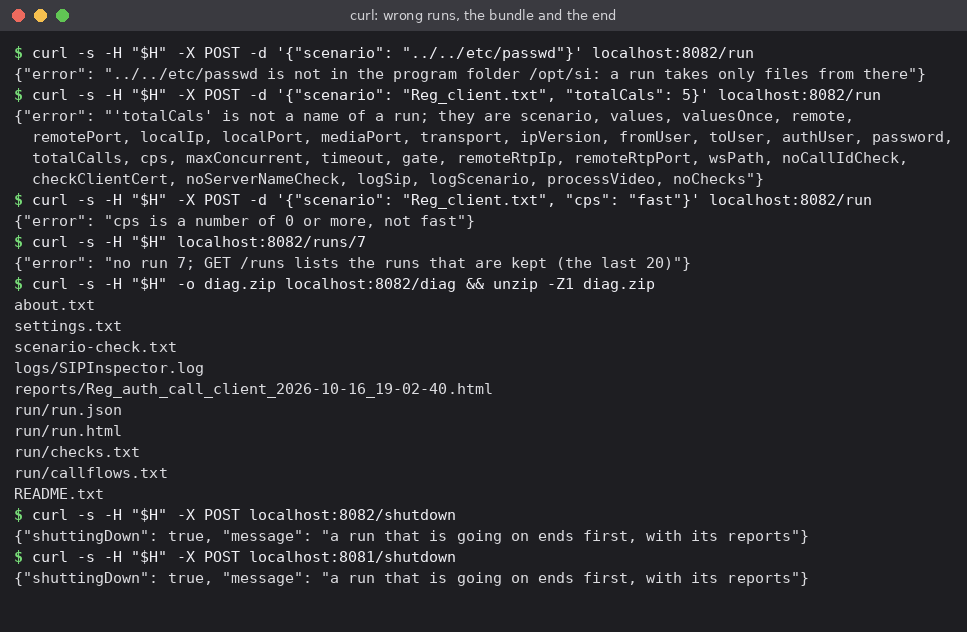
A run that is wrong is refused before anything is done, with 400 and the reason: a file outside the program folder, a name that is not a name of a run, a value that is not a number. GET /diag gives the diagnostics bundle, and POST /shutdown ends a service:
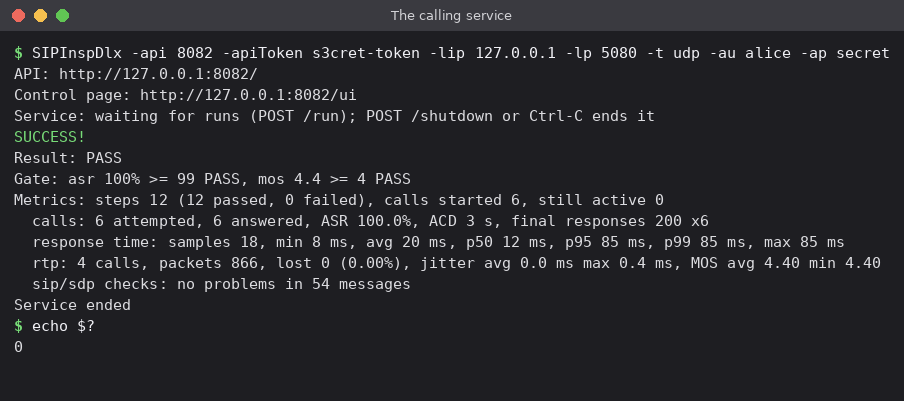
The calling service printed the summary of its run, and ended with exit code 0:
Answers
| Code | When |
|---|---|
200 | The answer: a status, numbers, a report, a list of runs, a bundle |
202 | POST /run, POST /stop, POST /shutdown: taken, it happens in the background (GET /status follows it) |
400 | A request that is wrong: a body that is not JSON, a name that is not known, a value that is not a number, a file outside the program folder, a gate that cannot be read |
401 | No token, or a wrong one |
404 | No such request, or no such run (GET /runs/7 when 7 is not kept) |
405 | The request with the wrong method, for example GET /stop; the Allow header says which one |
409 | Not now: a run while one is going on, POST /run to a program started with -fs, PUT /rate for a server, before the first call or after the last one, POST /stop of a service without a run, the numbers of a run that could not be started |
500 | The program failed; the reason is in the answer and in SIPInspector.log |
Every error answer is JSON with an error that says what is wrong, so a script can print it as it is.
A test from a CI job
A shell step that runs one test on the calling service, waits for its end, keeps its JUnit report and ends with the exit code of the run, so the job fails when the test fails. The token comes from a secret variable of the CI server (SI_TOKEN):
API=http://10.0.0.5:8082
H="Authorization: Bearer $SI_TOKEN"
RUN=$(curl -s -H "$H" -X POST -d '{"scenario": "Reg_call_client.txt", "remote": "10.0.0.9",
        "totalCalls": 20, "cps": 2, "gate": "asr>=99,mos>=4.0"}' $API/run \
      | sed -n 's/.*"run": \([0-9]*\).*/\1/p')
[ -n "$RUN" ] || exit 2
while curl -s -H "$H" $API/runs/$RUN | grep -qE '"state": "(starting|running)"'; do sleep 2; done
curl -s -H "$H" "$API/report?run=$RUN&format=junit" > sip-test.xml
exit $(curl -s -H "$H" $API/runs/$RUN | sed -n 's/.*"exitCode": \([0-9]*\).*/\1/p')
A regression suite in Python
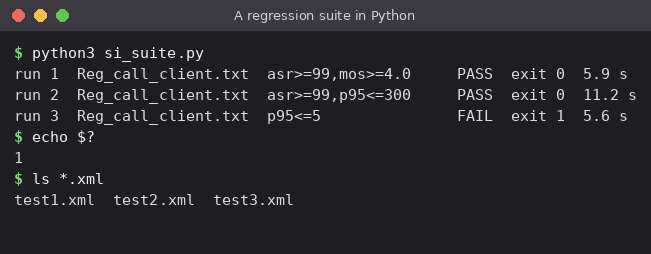
samples/api/si_suite.py runs a list of tests on the calling service, one after another, saves the JUnit report of every test and ends with exit code 1 when one failed. It needs Python 3 and nothing else. Set API, TOKEN and REMOTE at the top, and the tests in TESTS: each is a POST /run, so every name of a run can be used.
#!/usr/bin/env python3
"""A regression suite on a SIP Inspector service, with a JUnit report of every test."""
import json, sys, time, urllib.error, urllib.request

# the calling service: SIPInspDlx -api 8082 -apiToken s3cret-token ...
API = "http://127.0.0.1:8082"
TOKEN = "s3cret-token"
REMOTE = {"remote": "127.0.0.1", "remotePort": 5070}   # the device under test

TESTS = [
    {"scenario": "Reg_call_client.txt", "totalCalls": 4, "cps": 2,
     "gate": "asr>=99,mos>=4.0"},
    {"scenario": "Reg_call_client.txt", "totalCalls": 9, "cps": 3, "maxConcurrent": 3,
     "gate": "asr>=99,p95<=300"},
    {"scenario": "Reg_call_client.txt", "totalCalls": 4, "cps": 2, "gate": "p95<=5"},
]


def call(method, path, body=None, raw=False):
    data = None if body is None else json.dumps(body).encode()
    req = urllib.request.Request(API + path, method=method, data=data,
                                 headers={"Authorization": "Bearer " + TOKEN})
    try:
        with urllib.request.urlopen(req) as r:
            text = r.read().decode()
    except urllib.error.HTTPError as e:      # 400, 404, 409: the answer says why
        text = e.read().decode()
    return text if raw else json.loads(text)


failed = 0
for test in TESTS:
    run = call("POST", "/run", dict(test, **REMOTE))
    if "error" in run:
        print("not started:", run["error"])
        failed += 1
        continue
    n = run["run"]
    while True:                               # one run at a time: wait for its end
        status = call("GET", "/runs/%d" % n)
        if status["state"] in ("finished", "failed"):
            break
        time.sleep(1)
    with open("test%d.xml" % n, "w") as f:
        f.write(call("GET", "/report?run=%d&format=junit" % n, raw=True))
    print("run %d  %-20s %-20s %s  exit %s  %.1f s" % (n, test["scenario"], test.get("gate", ""),
                                                      status["result"], status["exitCode"],
                                                      status["seconds"]))
    failed += status["exitCode"] != 0
sys.exit(1 if failed else 0)
The third test asks for a p95 of at most 5 ms, which the network does not give, so it fails and so does the suite:
Keeping it safe
- The API listens on 127.0.0.1 unless
-apiHostsays otherwise. Open it to the network only where it is needed, for example-apiHost 10.0.0.5(one network card) rather than 0.0.0.0. - Whoever has the token can make calls from this computer. Use a long random token, keep it in the secrets of the CI server, and give every service its own.
- The API speaks HTTP, not HTTPS: the token can be read on the network. Keep it in a lab network, or put a reverse proxy with TLS (nginx, Caddy) in front of it.
- A run takes files only from the program folder and cannot name a file the program writes; the reports are read over the API.