Run reports
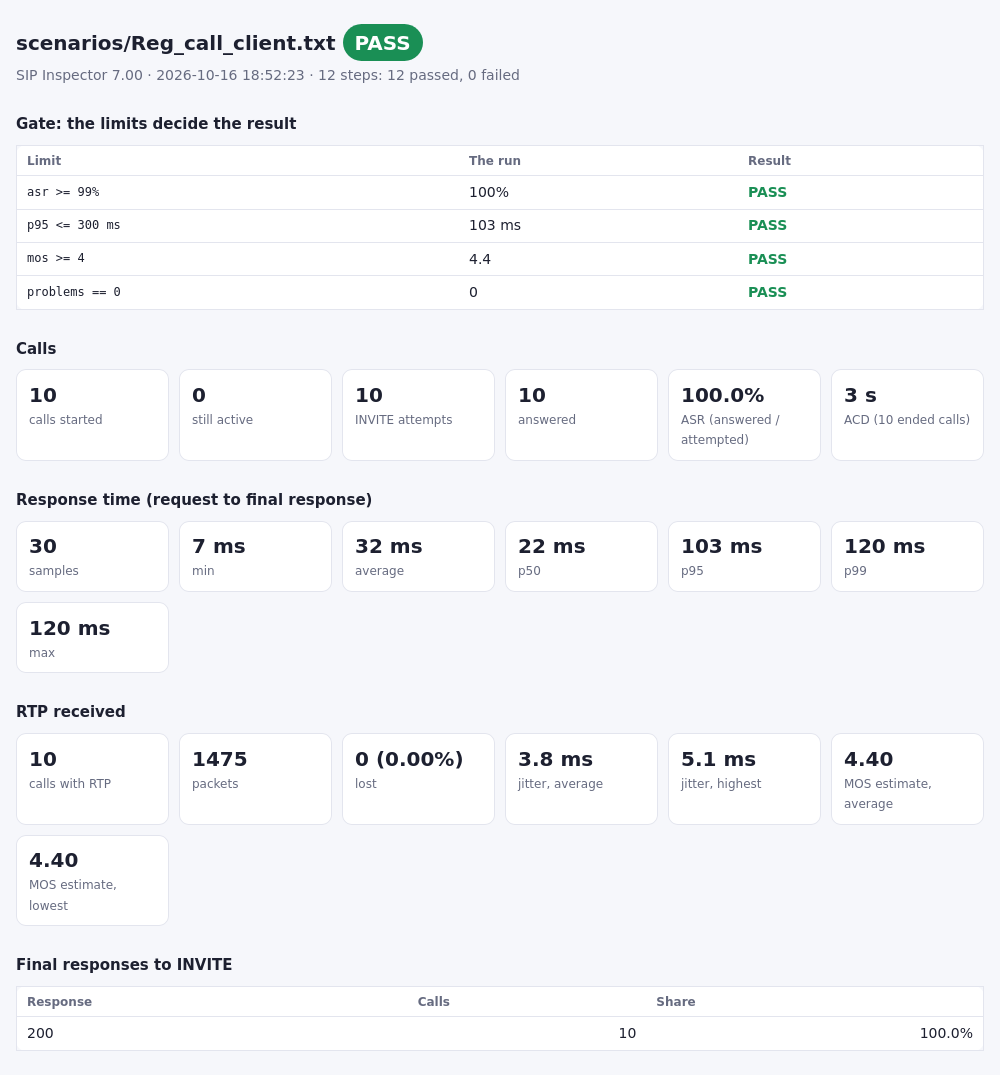
Every run can be written as a report in four formats. They have the same numbers; each is made for a different reader. The files of the examples below are in the samples/reports folder of the program: passed_run, 10 calls that all went well, and failed_run, 3 calls against a device that answers with a codec that was not offered.
| Format | For | How to get it |
|---|---|---|
| HTML | People: the result, the numbers, the steps, the SIP/SDP checks and the call flow on one page | GUI Report... (a .html name), Options/Save Run Reports (the Reports folder), -html, GET /report |
| CSV | Spreadsheets: the totals as # name,value lines, then a table of the steps | GUI Report... (a .csv name), -report, GET /report?format=csv |
| JUnit XML | CI servers (Jenkins, GitLab, Azure DevOps, GitHub Actions): every step and every gate limit is a test case | GUI Report... (a .xml name), -junit, GET /report?format=junit |
| JSON | Scripts and tools: the verdict and why, the gate, the numbers, the steps, the checks and the call flow | -json, GET /metrics, GET /report?format=json |
SIPInspDlx -lip 10.0.0.5 -rip 10.0.0.9 -fs scenarios/Reg_call_client.txt -tc 10 -cps 2 -mc 5 -np \
           -gate "asr>=99,p95<=300,mos>=4.0,problems==0" \
           -html passed_run.html -report passed_run.csv -junit passed_run.xml -json passed_run.json
The HTML report
The page starts with the scenario and the verdict, PASS or FAIL, and why it failed. With a gate, a table shows every limit, the number of the run and whether it held. Then come the calls (started, still active, dropped, INVITE attempts, answered, ASR, ACD), the response times, the RTP that came in (packets, loss, jitter, MOS), the final responses to the INVITEs and every step of the scenario. The page needs nothing but a browser and follows its light or dark theme.
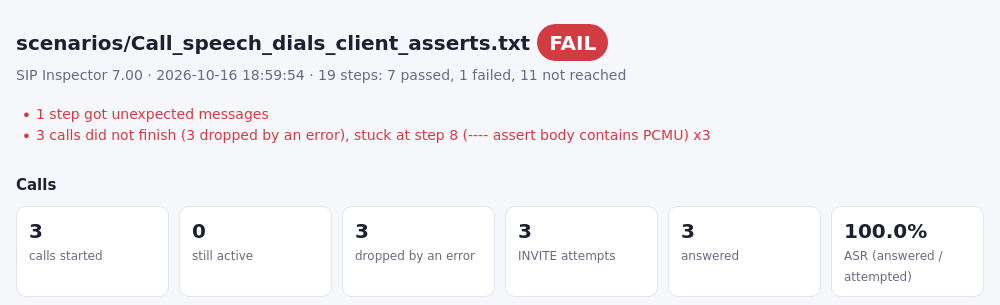
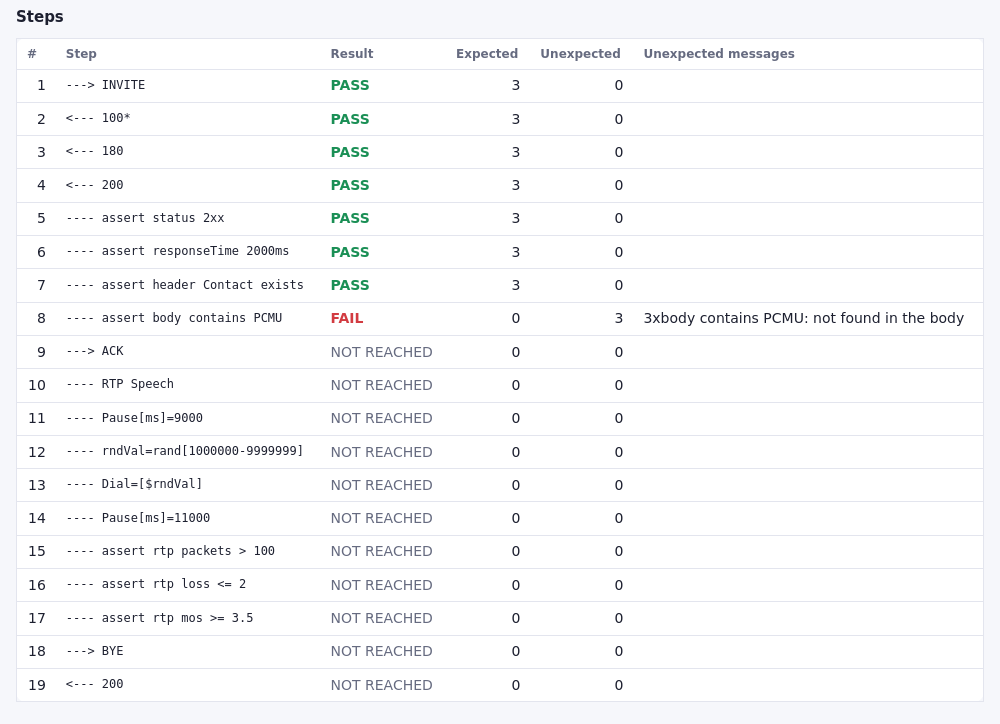
A run that failed says why at the top. In the steps the failed one is red with the reason, and the steps after it that no call reached are NOT REACHED, so it is clear where the calls stopped.
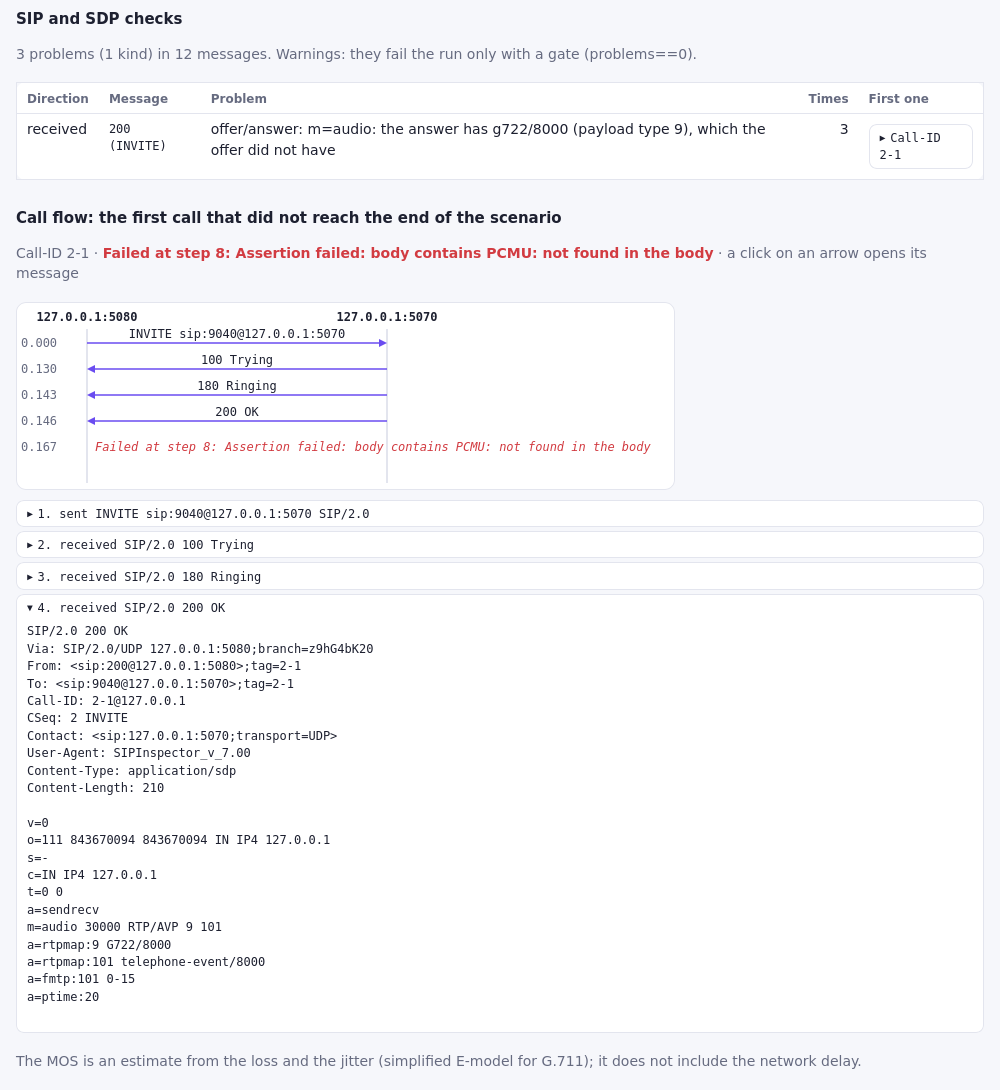
The page ends with the SIP/SDP checks and the call flow of the first call that did not reach the end. A click on an arrow opens its message: here the 200 OK, whose SDP has G.722 (payload type 9) where the client offered PCMU. That is both why the assertion failed and what the checks found.
The CSV report
The first lines are the totals of the run, one # name,value line each, with the same names as the properties of the JUnit report, the JSON metrics and the Prometheus metrics of the API. Then comes a table with one row per step. A spreadsheet opens it as it is; a script reads the totals from the lines that start with #. passed_run.csv, a few of its total lines left out:
# scenario,"scenarios/Reg_call_client.txt"
# callsStarted,"10"
# callsActive,"0"
# steps,"12"
# stepsFailed,"0"
# stepsNotReached,"0"
# result,"PASS"
# resultReasons,""
# gate,"asr>=99,p95<=300,mos>=4.0,problems==0"
# gate.asr>=99,"PASS 100%"
# gate.p95<=300,"PASS 103 ms"
# gate.mos>=4,"PASS 4.4"
# gate.problems==0,"PASS 0"
# notCounted,""
...
# calls.attempted,"10"
# calls.answered,"10"
# calls.asrPercent,"100.00"
# calls.acdMs,"3100"
# responseTime.p95Ms,"103"
# rtp.mosAvg,"4.40"
# checks.messages,"90"
# checks.problems,"0"
stepIndex,step,result,expected,unexpected,unexpectedMessages
1,"---> REGISTER",PASS,10,0,""
2,"<--- 200",PASS,10,0,""
3,"New Dialog",PASS,10,0,""
4,"---> INVITE",PASS,10,0,""
5,"<--- 100*",PASS,10,0,""
6,"<--- 180",PASS,10,0,""
7,"<--- 200",PASS,10,0,""
8,"---> ACK",PASS,10,0,""
9,"---- Play pcap=test.pcap",PASS,10,0,""
10,"---- Pause[ms]=3000",PASS,10,0,""
11,"---> BYE",PASS,10,0,""
12,"<--- 200",PASS,10,0,""
The JUnit XML report
A CI server shows a JUnit report as tests: the suite is the scenario, and every step is a test case that passed, failed (with the reason) or was skipped (no call got to it). Test case 0 says whether every call reached the end of the scenario. With a gate, every limit is a test case too, and only the limits decide: a step with a few failed calls is then not a failure of the suite. The totals are the properties of the suite. failed_run.xml, without its properties and the classname of every test case:
<?xml version="1.0" encoding="UTF-8"?>
<testsuite name="scenarios/Call_speech_dials_asserts_client.txt" tests="20" failures="2" errors="0" skipped="11">
<properties>
...
</properties>
<testcase name="0 every call reaches the end of the scenario">
<failure message="3 calls did not finish (3 dropped by an error), stuck at step 8 (---- assert body contains PCMU) x3">3 calls did not finish (3 dropped by an error), stuck at step 8 (---- assert body contains PCMU) x3</failure>
</testcase>
<testcase name="1 ---> INVITE">
</testcase>
...
<testcase name="8 ---- assert body contains PCMU">
<failure message="expected 0, unexpected 3: 3xbody contains PCMU: not found in the body">expected 0, unexpected 3: 3xbody contains PCMU: not found in the body</failure>
</testcase>
<testcase name="9 ---> ACK">
<skipped message="no call got to this step"/>
</testcase>
...
</testsuite>A CI job runs the test and hands the report to the CI server; the exit code of the program fails the job. In Jenkins and GitLab:
// Jenkinsfile
sh 'SIPInspDlx -lip 10.0.0.5 -rip 10.0.0.9 -fs scenarios/Reg_call_client.txt -tc 100 -np -junit results/sip.xml'
junit 'results/sip.xml'

# .gitlab-ci.yml
sip-test:
  script:
    - SIPInspDlx -lip 10.0.0.5 -rip 10.0.0.9 -fs scenarios/Reg_call_client.txt -tc 100 -np -junit sip.xml
  artifacts:
    when: always
    reports:
      junit: sip.xml
The JSON report
result is PASS or FAIL and reasons says why; gate has every limit with the number of the run (null without a gate); metrics has the totals; checks what the SIP/SDP checks found; callFlow the first line of every message of the call that the HTML report shows; steps every step. The start of failed_run.json and its checks and call flow:
{
  "scenario": "scenarios/Call_speech_dials_asserts_client.txt",
  "result": "FAIL",
  "reasons": ["1 step got unexpected messages", "3 calls did not finish (3 dropped by an error), stuck at step 8 (---- assert body contains PCMU) x3"],
  "gate": null,
  "metrics": {
    "callsStarted": 3,
    ...
  },
  "checks": {"messages": 12, "problems": 3, "unlisted": 0, "list": [
    {"direction": "received", "message": "200 (INVITE)", "problem": "offer/answer: m=audio: the answer has g722/8000 (payload type 9), which the offer did not have", "count": 3, "callId": "2-1"}
  ]},
  "callFlow": {"callId": "2-1", "problem": "Failed at step 8: Assertion failed: body contains PCMU: not found in the body", "shown": "the first call that did not reach the end of the scenario", "events": [
    {"ms": 0, "kind": "sent", "from": "127.0.0.1:5080", "to": "127.0.0.1:5070", "line": "INVITE sip:9040@127.0.0.1:5070 SIP/2.0"},
    {"ms": 130, "kind": "received", "from": "127.0.0.1:5070", "to": "127.0.0.1:5080", "line": "SIP/2.0 100 Trying"},
    ...
    {"ms": 167, "kind": "note", "from": "127.0.0.1:5080", "to": "127.0.0.1:5080", "line": "Failed at step 8: Assertion failed: body contains PCMU: not found in the body"}
  ]},
  "steps": [
    ...
Call flow
Call Flow in the scenario screen shows the messages of a call as a ladder diagram, while the run goes on: one line for each end of the call, one arrow for each message, with the time from the first message. Click a message, or move with the arrow keys, and it is shown whole below. A message sent again because no answer came is a dashed arrow, a response of 400 and up is red, and why a call did not reach the end of the scenario (a time out, a failed step or assertion, the run stopped) is the last line, in red.
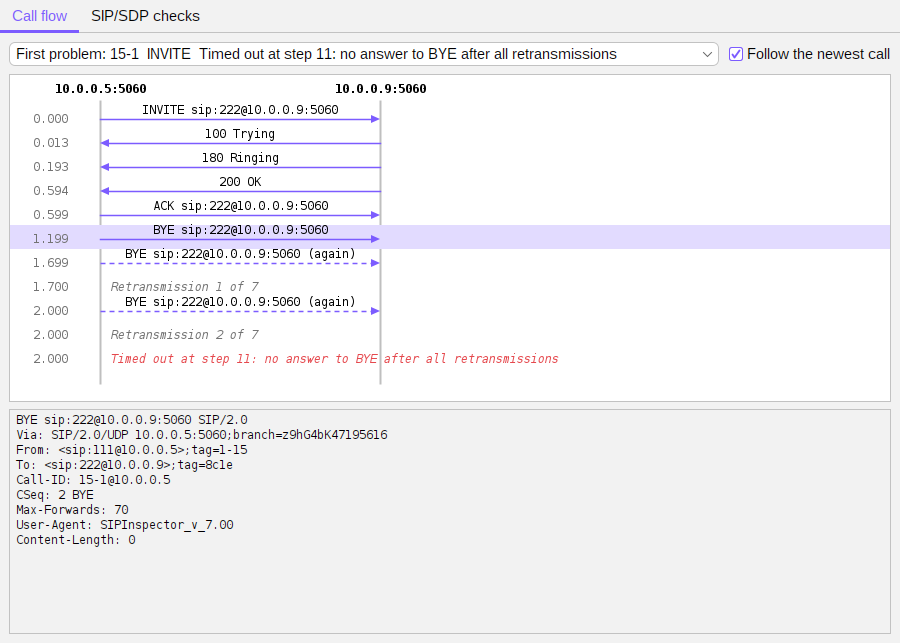
The list above the ladder has the calls that are going on, the last 20 calls that ended, and the first problem: the first call of the run that did not reach the end, which is kept for the whole run. Follow the newest call shows the call that started last as calls come and go; picking a call in the list turns it off. A call keeps its first 200 lines.
The run reports have the call flow too. The HTML report (and the report of Report..., -html and the API) ends with the ladder of the first call that did not reach the end, else of a call that was still going at the end, else of the last call; a click on an arrow opens its message. The JSON report has it under callFlow. A CI job that fails can be looked at without running it again.
SIP and SDP checks
Every message that a call sends and receives is checked against the SIP and SDP rules: what the other side gets wrong, and what a scenario sends wrong. What is found is a warning. It does not change the result of the run: a device that sends a 200 OK without a To tag may still be what you want to test. A gate with problems==0 makes a run pass only with clean messages.
| What | The checks |
|---|---|
| SIP (RFC 3261) | The start line; Via, From, To, Call-ID, CSeq and in a request Max-Forwards; a header that must be there once and is there twice; the branch of the Via starts with z9hG4bK; the tag of From, and of To in a response (except 100); CSeq number and method; Contact in an INVITE and its 2xx; Content-Length (over TCP and TLS it must be there) and Content-Type of a body; CRLF line ends |
| SDP (RFC 4566) | v=0 first; o=, s= and t= once and in their order; c= for the session or every stream, with an address of its type; m= with a port and payload types of 0 to 127; an a=rtpmap for every dynamic payload type, and none for a payload type that is not offered; a=crypto only with RTP/SAVP, and RTP/SAVP with a key |
| Offer/answer (RFC 3264) | The answer has as many m= lines as the offer, in the same order; no codec that the offer did not have (compared by name, so another payload type number is fine); a direction that fits the offer (sendonly is answered with recvonly or inactive); an SRTP stream is accepted with a key. A late offer (in the 200) answered in the ACK is checked too |
The same problem of the same kind of message is counted, not listed again: a run of 10 000 calls with one wrong header has one line that says 10000. The console prints the first five; the HTML and JSON reports, the diagnostics bundle and the Checks button of the scenario screen have all of them, each with the first message that had it. The program log has a line for every new kind.
  sip/sdp checks: 1 problem (1 kind) in 9 messages
    received 200 (INVITE): offer/answer: m=audio: the answer has g722/8000 (payload type 9), which the offer did not have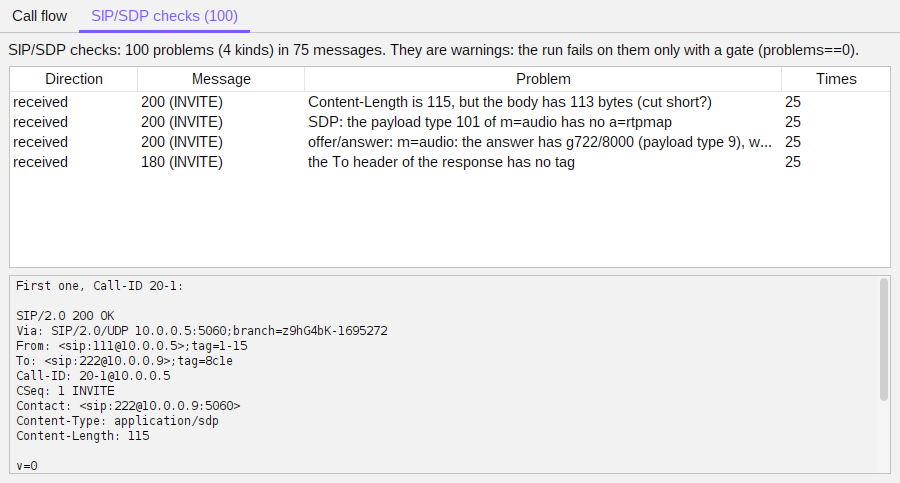
The checks cost little, but in a load test where every bit of CPU counts they are turned off with -noChecks (noChecks in POST /run). Validate Scenario has the same SDP rules for the messages of a scenario before it is run.